Post-field trial debrief with the LOC-NESS science team
By Sarah Schumann
August 25 — I recently had the opportunity to be a fishing industry observer on the first ocean alkalinity enhancement field trial in U.S. federal waters. Aboard the OSV Peter M. Mahoney, I spent six hours watching engineers from the Woods Hole Oceanographic Institute (WHOI) “Locking Ocean Carbon in the Northeast Shelf and Slope" (LOC-NESS) project release 16,500 gallons of sodium hydroxide along with rhodamine tracer dye into the surface waters of Wilkinson’s Basin in the Gulf of Maine. You can read my field notes here.
All the while the OSV Mahoney was circling the field trial location to create an 800-meter red-dyed alkaline patch, there was another boat trailing 200 meters behind: the R/V Connecticut, which carried a team of WHOI scientists and their data collection instruments. The Connecticut stayed on location for four days after the Mahoney left the scene, collecting measurements of how that area of ocean responded to the dispersal physically, chemically, and biologically.
A week after the R/V Connecticut returned to port, I caught up with two of the lead scientists on board: Adam Subhas and Jennie Rheuban. I was curious to hear how the experiment went from their standpoint, what kind of data they had collected, and what preliminary results they were ready to share from the field trial. Even more than that, I was interested in the implications of their experience for future marine carbon dioxide removal (mCDR) field trials, and how their interactions with the New England fishing industry had shaped their plans.
Here’s what I learned.
(complete photo captions and credits are found at the bottom of the blog post)
They collected a lot of data.
Sarah: I saw the R/V Connecticut from a distance while I was on the OSV Mahoney, and I heard that you guys stayed out another four days after we came in. What kinds of data were you collecting that whole time?
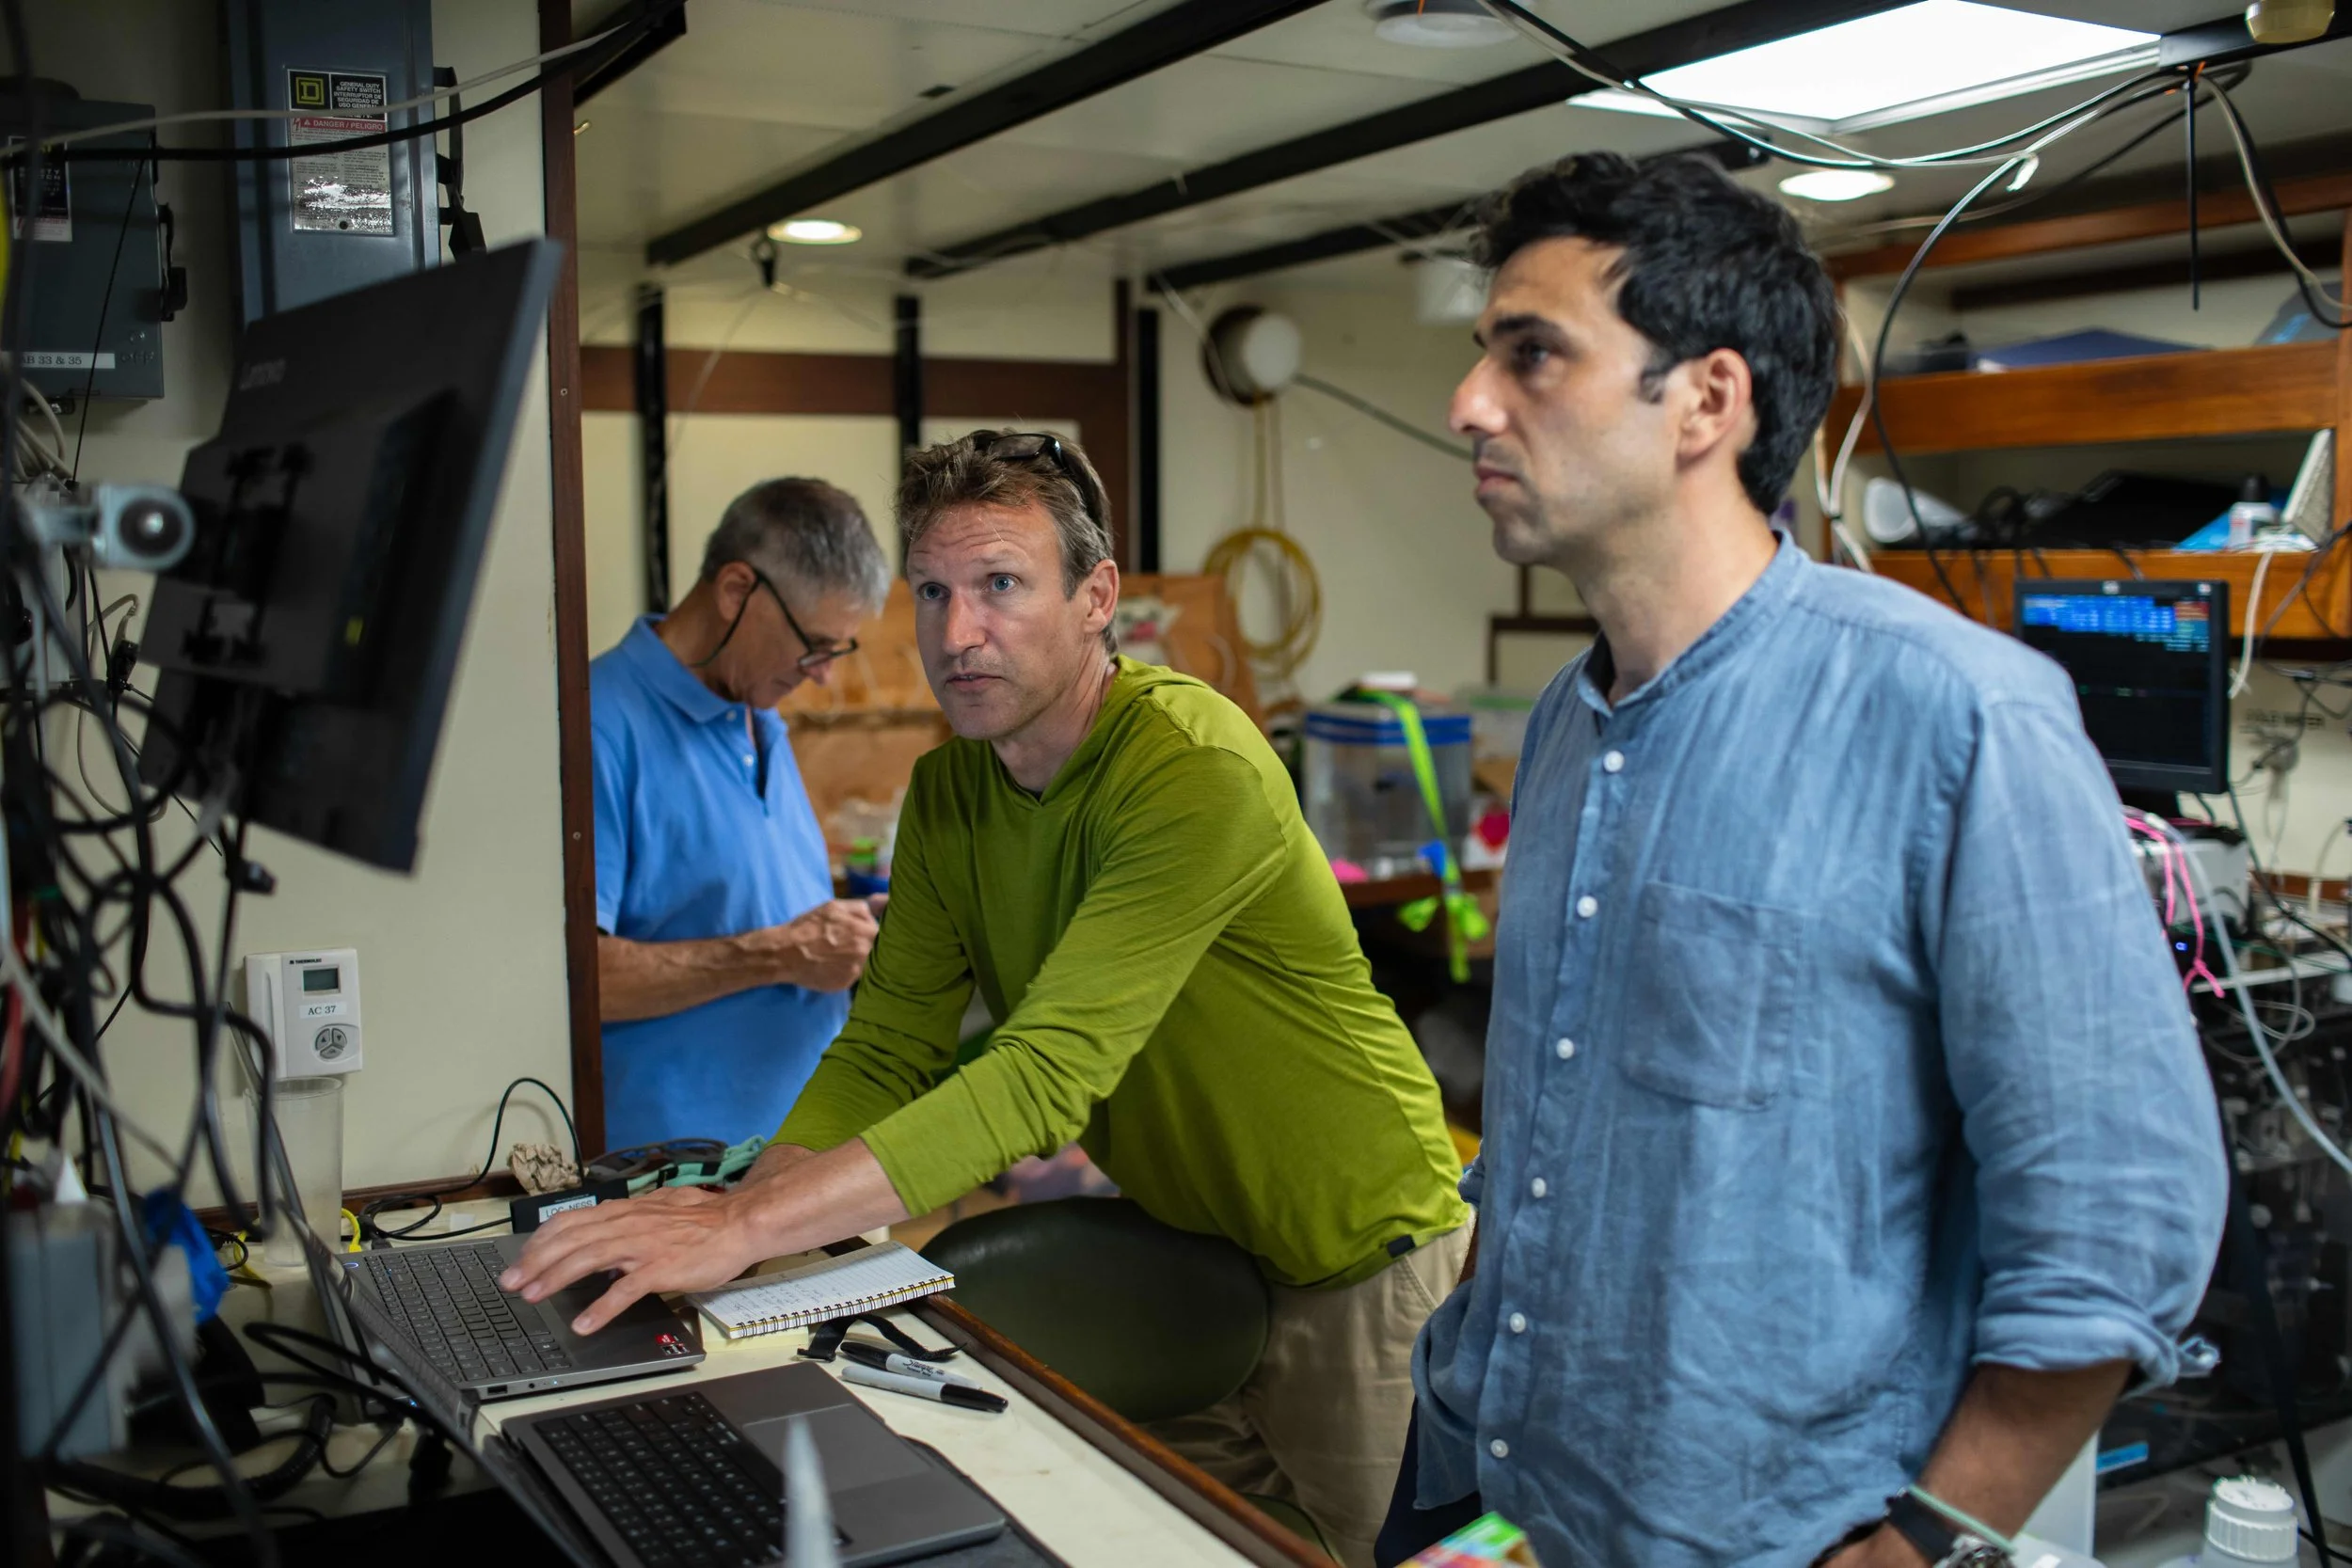
Adam: The main set of measurements that we took were on the ship's underway system. There's a pump that pulls in water from underneath the ship's hull. It's about two meters deep, and sends that water up to the main lab, and we connected a string of instruments to measure properties of that water continuously through time. The things that we measured — I'll just list them out — are pH, total alkalinity, carbon dioxide concentration, rhodamine fluorescence, oxygen concentration, and a measurement of photosynthetic health.
Jennie: Also there were temperature and salinity measurements. The highest frequency of measurements was every second.
Adam: We have the GPS location for every measurement, too. What we'll be able to do is essentially reconstruct the physical, chemical, and biological characteristics of that surface water over the duration of the dispersal and the monitoring period.
Sarah: You said biological characteristics. How were you measuring impacts to sea life?
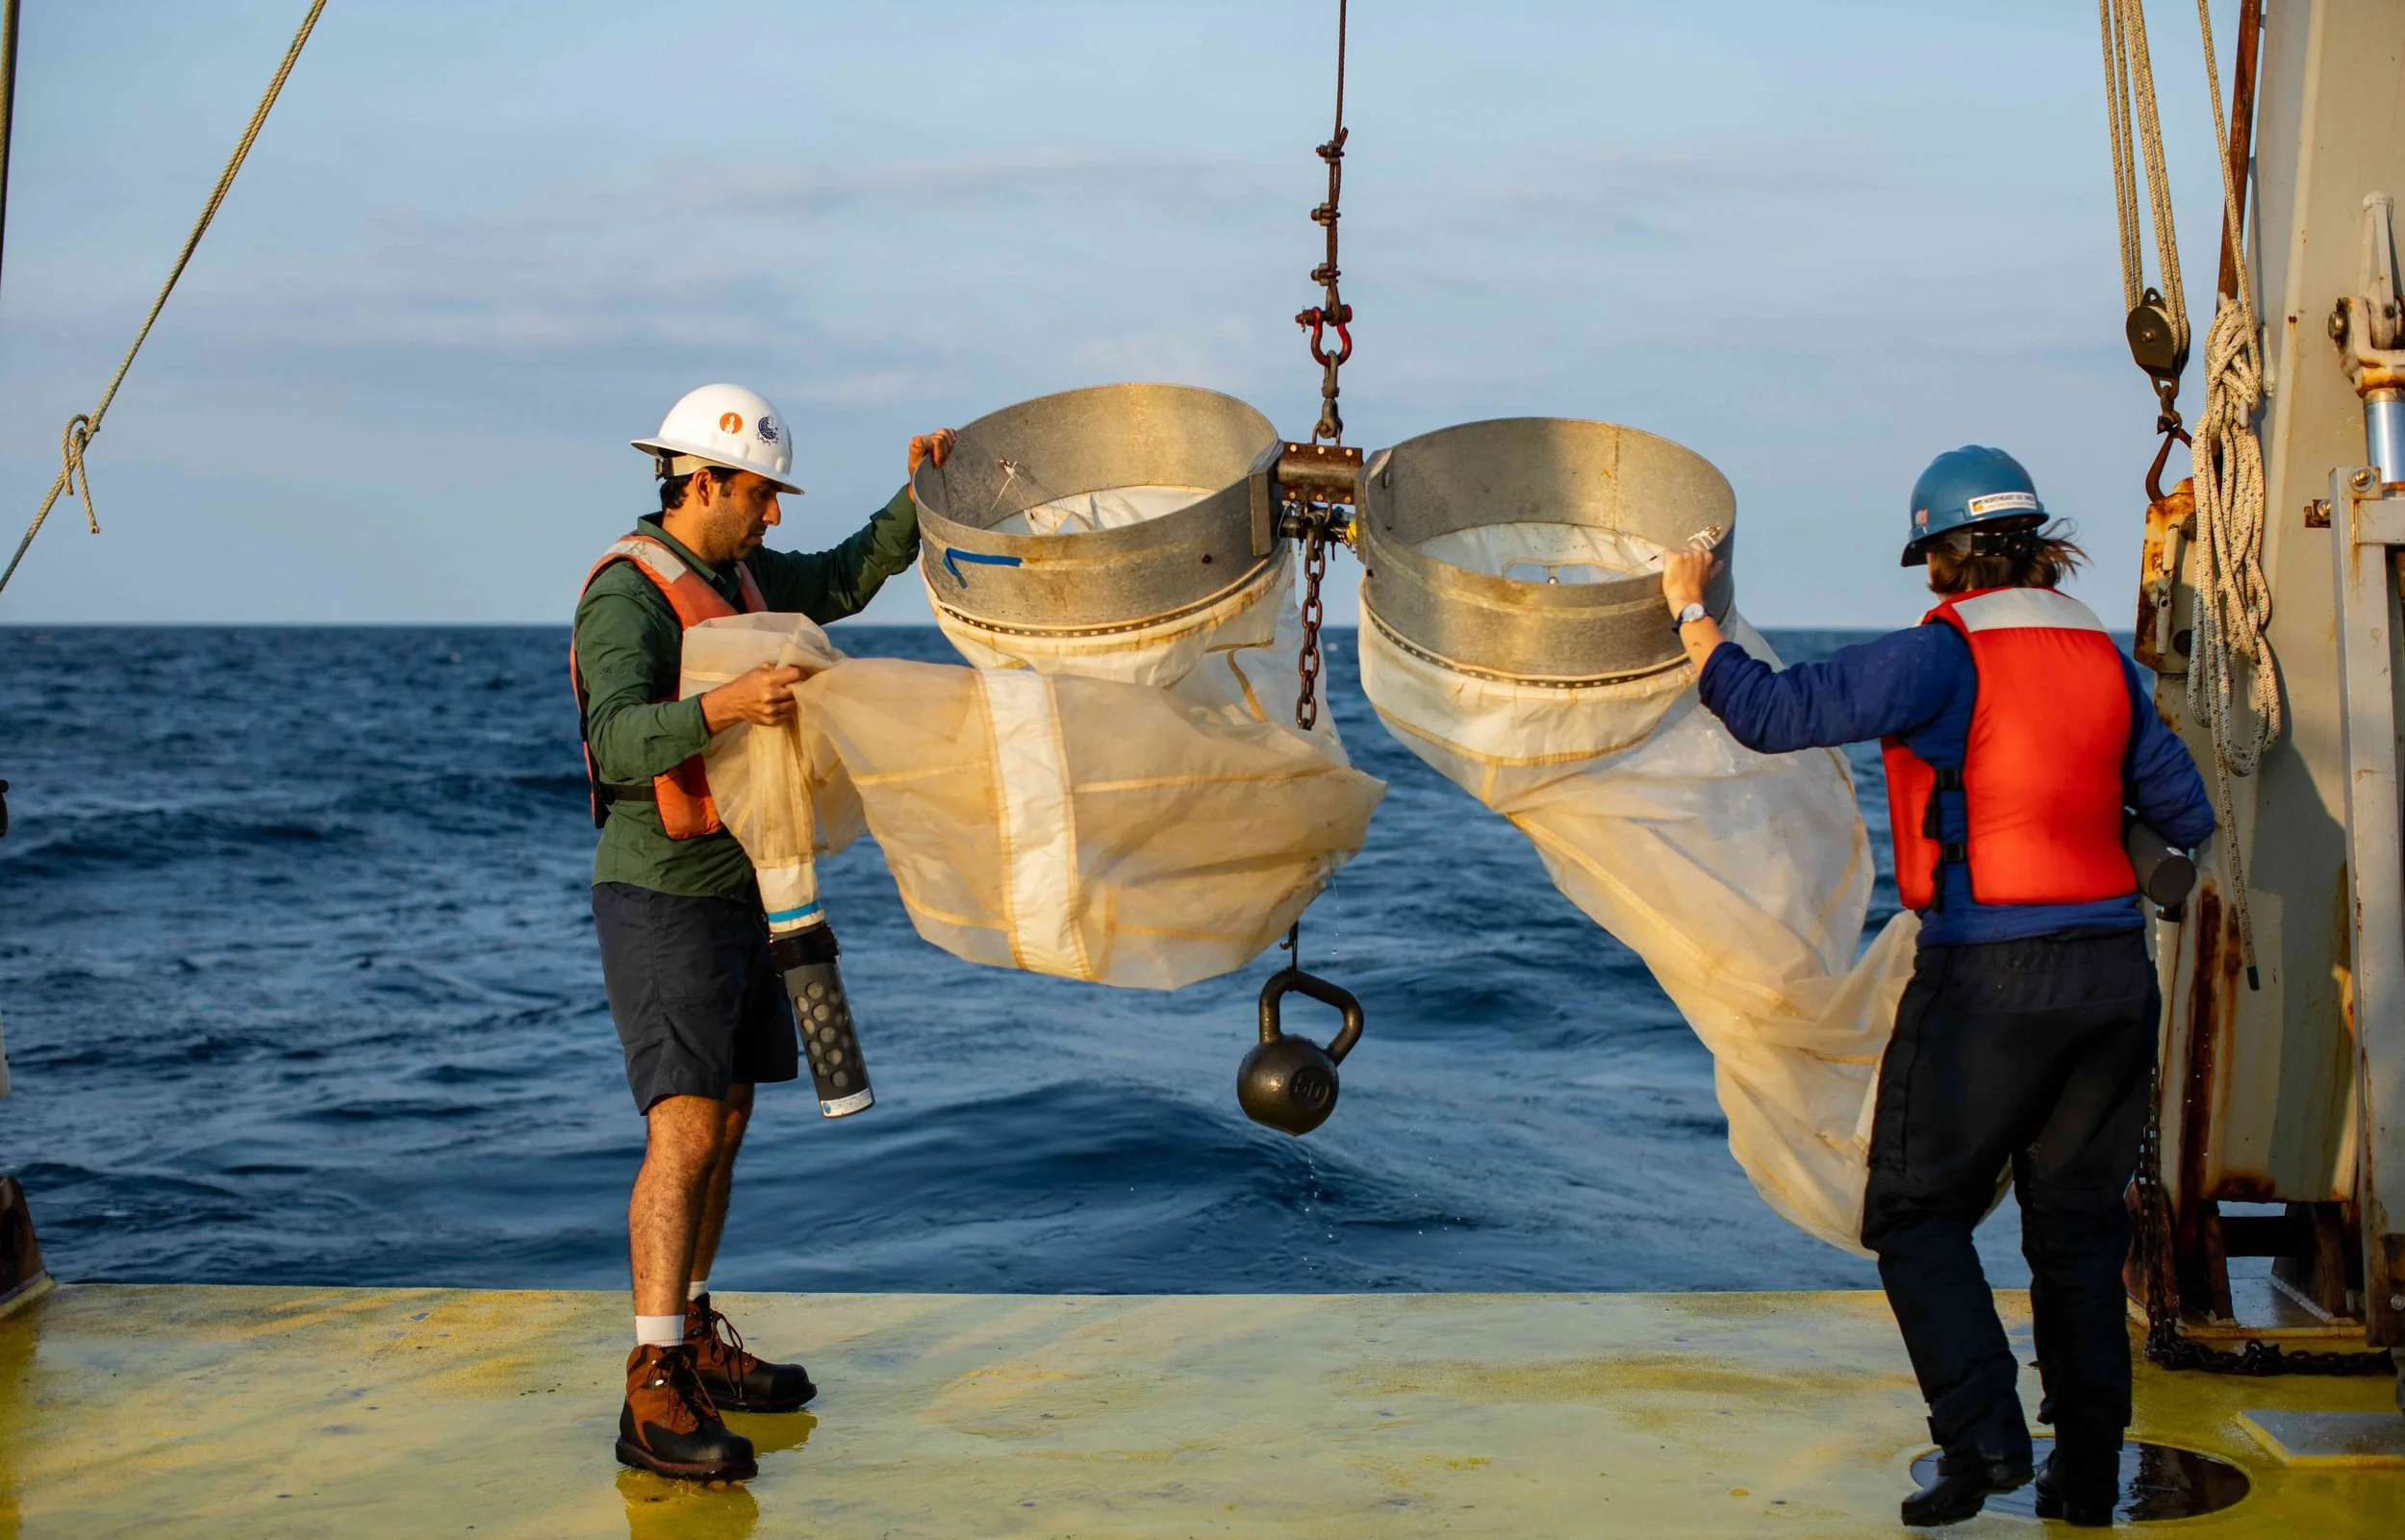
Adam: We conducted plankton tows. We did bongo net tows, which are what NOAA EcoMon [the Northeast Fishery Science Center’s Ecosystem Monitoring program] does for assessing zooplankton and fish larvae abundance. We used those tows because we can compare with the NOAA datasets. We took those measurements inside and outside the patch every day, to get a comparison. We also did neuston net tows, which basically just tow right along the surface to look for surface-dwelling organisms, like lobster larvae and fish larvae that might be out there. We did those also inside and outside the patch every day. And we did CTD rosette casts. Are you familiar with what those are?
Sarah: No, I’m not. Enlighten me.
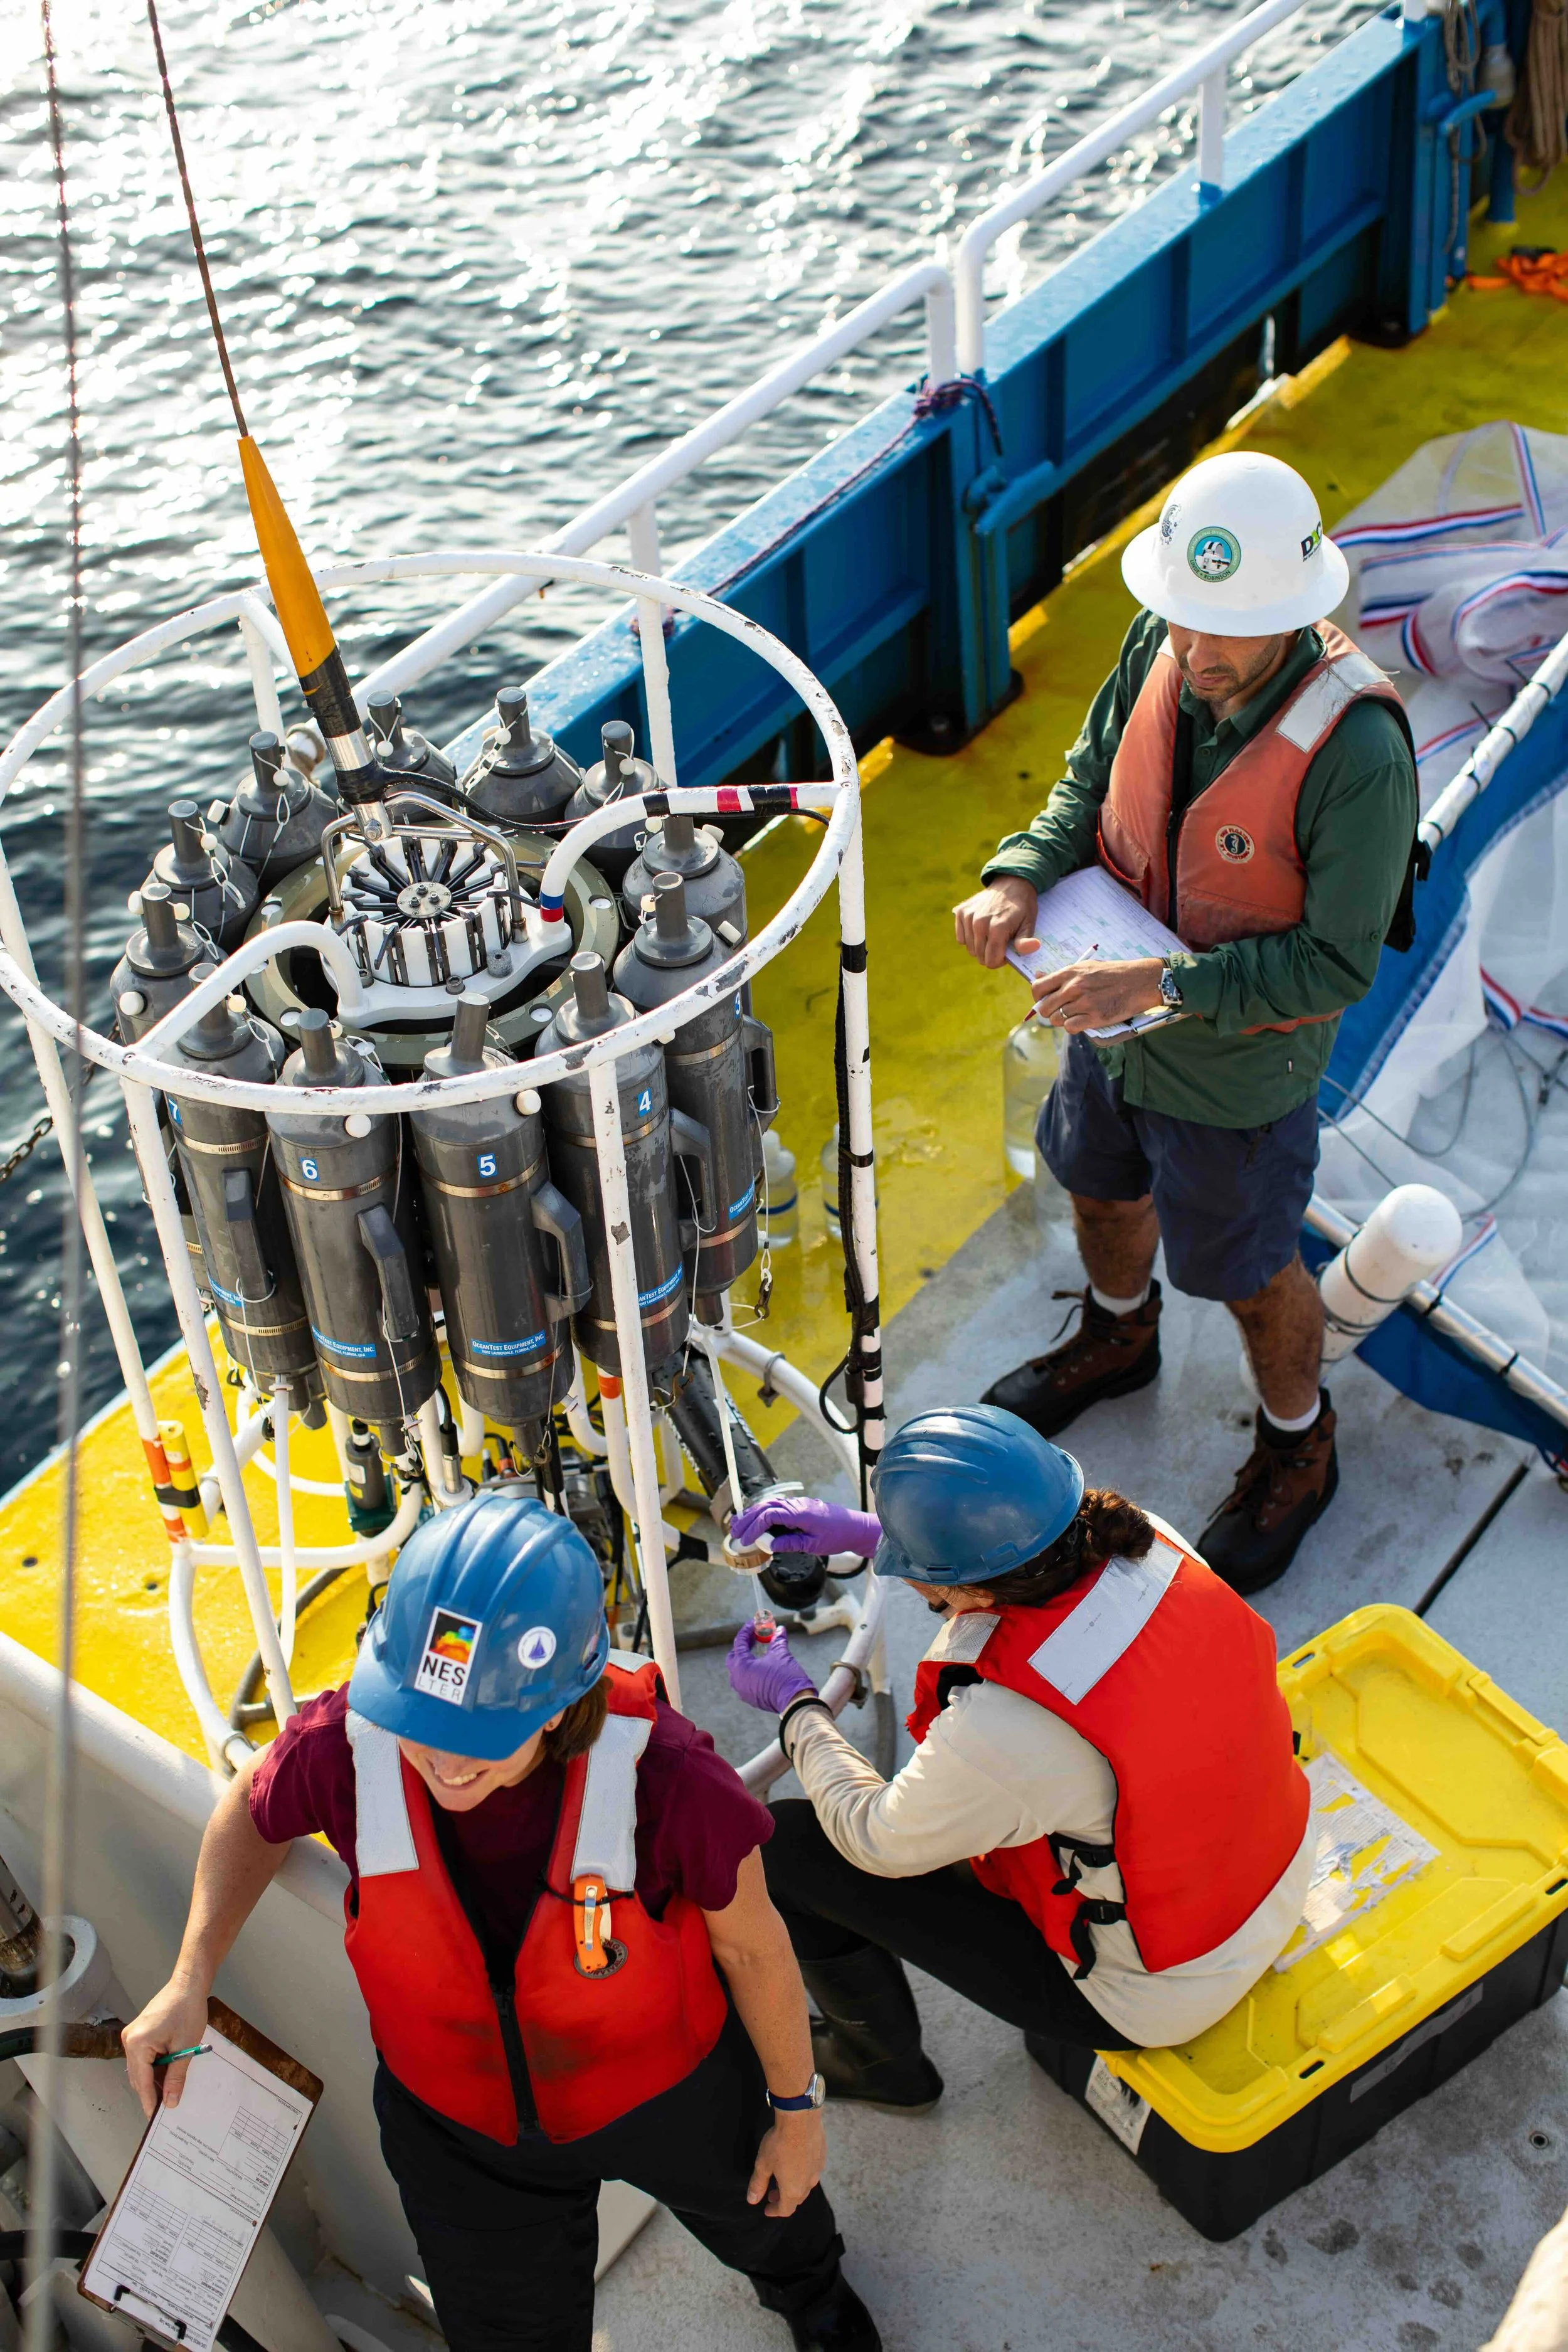
Adam: It's basically like a big cage that has a bunch of sensors on it, and then has a set of 12 bottles that you open, and then you send this whole cage over the side and lower it down into the water column. As you bring the cage back up onto the ship, you can trigger the bottles closed at different depths. The sensors give you real time information of what the vertical water column looks like. Then to supplement that, we can basically capture water at different depths, and then take samples of that water for more involved and sensitive measurements back on land. I think we were up to 31 or 32 CTD casts by the end of the monitoring period. Four days, 32 casts. Roughly every four to five hours, we were doing one of those.
Sarah: What did you measure with the CTD casts?
Adam: The things that we measured there, with the sensors, were pH, rhodamine fluorescence, particle concentration and size, chlorophyll, temperature, salinity, and oxygen. The samples that we took from the CTD bottles were a suite of samples for the carbonate system, particulate carbon measurements (to look at actually what amounts of carbon were there in the water, in terms of biomass), and chlorophyll... And we took a bunch of samples to measure the composition of the phytoplankton community: what kind of algae and photosynthetic organisms there are, what kind of bacteria there are, what kind of small animals are there, in terms of the smallest size classes of zooplankton. We took measurements for cell stress and death to look at how stressed cells might be. Then we took a bunch of samples for genetic analyses, to look at can we maybe get a broader picture of what kind of genes were being expressed or turned on as a measure of biological response at the genetic level to the alkalinity enhancement.
Sarah: That’s a lot of data. Is there more?
Adam: The other thing that we did was we collected water every day and incubated that water in a deck-board incubator to measure the primary production rate. To look at how much carbon was getting fixed by photosynthetic algae in that community every day. We did that inside and outside the patch, to compare whether there is a difference in the primary productivity of the patch versus the surrounding water. What am I missing, Jennie?
Jennie: We deployed eight drifters. Those are buoys that have sails underwater that are designed to move with the surface currents. Rather than sails catching wind, they're catching the currents. Those drifters were deployed both inside and outside the patch. They tell us their location every five minutes, but we also instrumented them with sensors as well. Five of those of those drifters were measuring water quality parameters like temperature, salinity, oxygen, pH and turbidity, as well as rhodamine fluorescence (concentrations of the dye). The other three drifters were measuring the dye concentration only. Some of them had sets of sensors attached to them at multiple depths, so they could track what we were seeing in and out of the patch over time.
Sarah: Were there also some unmanned systems involved?
Jennie: We had a number of autonomous vehicles that were out there as well. There were three spray gliders that were out there. Two had been deployed almost two weeks before the field trial, and had been out at the site for a number of days before the actual field trial. Then one was deployed a few days before the trial.
Sarah: How are those gliders deployed? Is that from a ship or from land?
Jennie: They got deployed off the Outer Cape and then moved autonomously northward to the field site. They'll get picked up again when they're done. They'll get piloted south. They'll be given a command to leave the field site. They'll come south on their own, so they can get picked up at a closer location that's a little bit more convenient.
Sarah: What kinds of data were the gliders collecting?
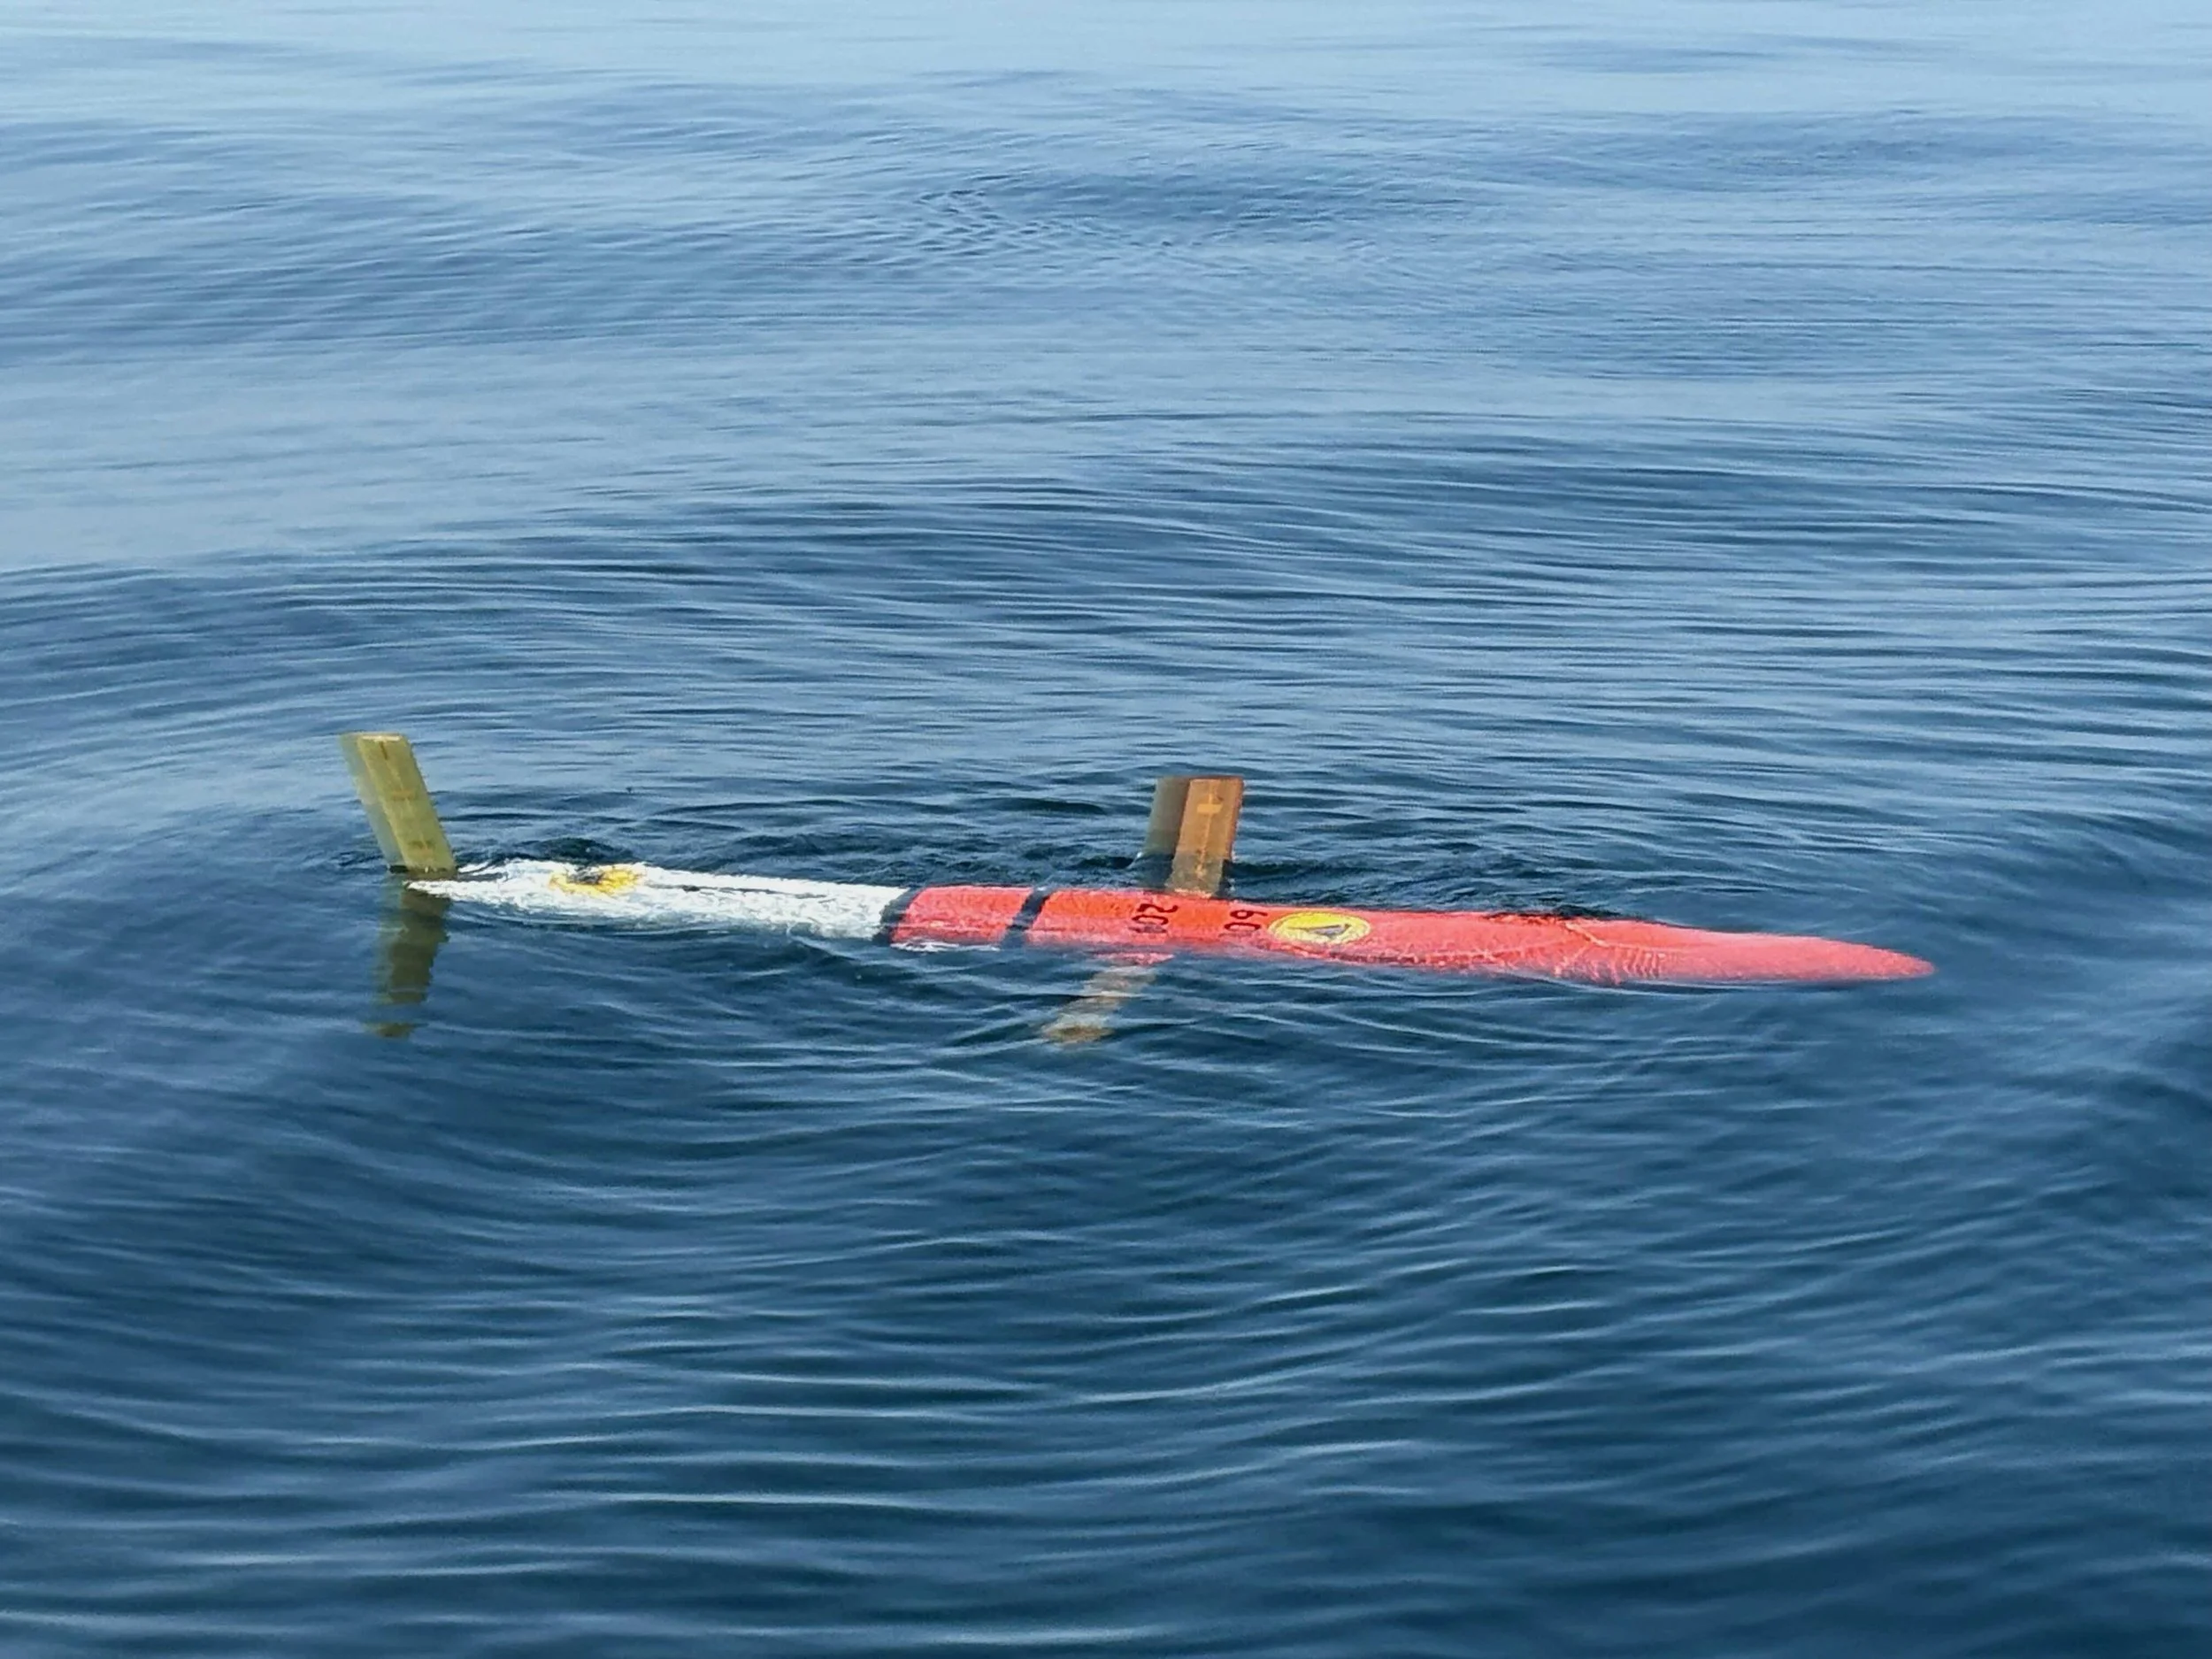
Jennie: Those instruments were measuring a similar suite of parameters as our drifters. Then there was also a long range MBARI Tethys Long Range Autonomous Underwater Vehicle (LRAUV). That's another type of autonomous vehicle that moves in the water a little bit differently than the gliders. It’s not able to stay out for as long of a period of time, but it’s much more flexible in how it moves around. That also had a similar suite of instruments that were attached to it and measuring things like rhodamine, fluorescence, pH, temperature, and salinity. We also get information from the gliders, in particular, on the currents, as well as a few other parameters. That AUV was actually deployed from out of Sandwich. They chartered a fishing vessel, the Tenacious II, out of Sandwich to go do that deployment.
Sarah: How large are the AUV and the gliders?
Adam: The gliders and AUV are about five or six feet long. The AUV is probably 10 inches in diameter. It looks like a torpedo.
Sarah: Did you also use drones to capture aerial images?
Adam: We had a couple of drones during the dispersal. But as you remember, it was quite windy, so the drone that we had on the Connecticut ended up not being able to fly… Instead, we were looking at satellite imagery. We did actually end up capturing a number of satellite images of the patch that you can see from space.
And they needed a lot of people to do it.
Sarah: That sounds like a lot of activity to keep track of at once. Do you have a tally of the total number of people who were actively involved in the dispersal and data collection during the field trial, either at the patch site or from land?
Adam: Like 50-ish people involved in this altogether.
Jennie: There was a team of people on shore, working twelve-hour shifts, along with us on the ship, piloting those gliders in real time... Two people were piloting that long range AUV on twelve-hour shifts as well. It was not just us out on the water, but a whole team of folks back on shore... We also had our modeling team there running forecasts for where they thought the patch might go, based on regional operational forecasting models. There was this really amazing group of people that were working together, not just on the ship, but shore-based and others. It was all different aspects of our team. It was pretty incredible to have this seamless connection of people working towards the same goal of tracking this patch.
Planning paid off.
Sarah: Did the R/V Connecticut have to come in any earlier than planned, with Hurricane Erin bearing down?
Adam: We ended up leaving at just past the four-day mark. The signals were quite small at that point, and then by the following morning, when the storm swell picked up and mixing really took over, the gliders also lost the patch completely. It would have been a challenge to continue to track it. By the time that swell and the winds really picked up, it basically all got mixed away. The EPA required us to be out for 72 hours, so we hit that. We stayed out for another day. Things were getting much more difficult to track, and then with the storm, we decided to come back in.
Sarah: Other than a hurricane on the horizon, were there any other surprises or challenges you had to overcome?
Adam: I don't think it could have gone much more smoothly than it did. It's just a testament to how we've been planning this experiment for so long, that by the time we were actually doing it, I feel like we were actually very prepared for everything.
Analyzing the data will take some time…
Sarah: Now that the experiment is behind you, you must have a tremendous amount of data to go through.
Adam: Just to give you a sense, we did like 31 vertical profiles of the water column. The gliders combined have done over 2,000 vertical profiles of the water column. We have this incredible high-resolution picture of what happened during this experiment. Now it's our job and our challenge to dig through all this. The big number is: how much carbon did this patch pull out of the atmosphere, and can we quantify that with our measurements? Then also from the biological point of view: can we identify any impacts or not?
Sarah: It sounds like you had a lot of different instruments collecting similar data. I’m sure there's a reason for all that redundancy. Could you explain that?
Adam: They're all going to give us complimentary pictures of what happened during the dispersal. The redundancy is really important because a lot of these sensors also have different levels of data quality and accuracy and precision. The state-of-the-art sensors that we were using on the ship's underway system are going to give us the best quality data, I would say, but we also wanted to evaluate: are there lower-cost tools that can be used effectively? And then, each of these platforms is operating at a slightly different perspective to the ocean, and the way that the ocean is moving around and diluting the patch. Each of those will give us a different angle on how this patch diluted and spread – and ideally how it took up carbon from the atmosphere. That's really the big open question.
But there are some takeaways already.
Sarah: Can you give us any sneak peaks into what the answer to that big open question might be?
Adam: One of the cool things about the shipboard data that we can definitely say now is that the pH of the surface ocean went up a little bit by the end of the dispersal. We were measuring a pH of about 8.3. Then it diluted back down to baseline conditions in about four days. We saw the same thing in the total alkalinity data: we saw that value enhanced, and then saw that enhancement slowly go away. We also saw the exact same thing with the CO2 concentration in seawater. Where pH increases, the CO2 concentration in seawater decreases. Because it decreases and the concentration in the atmosphere is the same, what happens is that the CO2 moves from the atmosphere into the ocean. That's the method of the carbon removal for ocean alkalinity enhancement. We clearly saw a decrease in the CO2 concentration of seawater. That was directly correlated with the pH increase, the alkalinity increase, and the presence of rhodamine water tracer dye. We can conclusively say already that we have successfully enhanced the alkalinity of seawater, and we set up the conditions for carbon uptake into the patch. The challenge for us moving forward is to then synthesize all these datasets and actually quantify how much carbon actually got removed from the atmosphere due to the experiment. That's going to be the big challenge for the next few months.
Sarah: What about the other big question: impacts to sea life?
Adam: There was no indication that there were significant impacts to the marine ecosystem. We didn't observe any protected species. There were no indications of mass mortality events. That was [a stipulation in the] permit that the protected species observers were specifically looking for. When we were looking at the photosynthetic health metric, there weren't any major things that popped out. The chlorophyll concentrations, when we were doing the CTD casts, all looked very consistent, whether we were inside or outside the patch. There hasn't been anything that we've looked at so far that has said there was a major impact to the biological community. Now, we have a lot more data and a lot more samples to look at and analyze. It's going to take us a while to do that. Plankton tows, too. The tows came up with organisms every single time, but it's going to take us some time to work up those data and actually say something about the impacts in detail.
Findings will be shared with the fishing industry.
Sarah: When can the world expect to see some of these results, and how are you planning to get them out there to laypeople, like the fishing industry?
Adam: We have a bunch of abstracts that we submitted to the Ocean Sciences Meeting in Glasgow [in February 2026]. That's going to be about the six-month mark… In terms of laypeople, we got a note back from the New England Fishery Management Council, saying, “When you have results to share, let us know.” I think now we know, for the most part, who to talk to, to start getting information out to the fishing community. We'll probably be working through the same channels that we've been working through [during the research planning phase] to get information out: a combination of direct emails, association newsletter blurbs and posts, and maybe some presentations to councils and at trade shows. We also just did a podcast with the Maine Coast Fishermen's Association; that’s another avenue we might use to get information out.
Jennie: To add a little bit of clarity on the timeline, some of the datasets that the fishing industry in particular has asked for the most – like the net tow information on zooplankton – we may not even get those results back from the company that’s going to be processing those samples until early next year, so it may be a little while before we have those results in hand to be able to share back. But certainly, as soon as we do have those, and have an opportunity to digest them, sharing them with the fishing community is a top priority for us.
LOC-NESS is setting the bar for mCDR…
Sarah: How do you think this work, once it’s published, will be used to inform future research and even planning and policy around ocean alkalinity enhancement?
Adam: That’s a big question. I think this experiment clearly was of interest to a whole lot of people, and I hope the results will be too. We did this because we want this science to make a difference for if and how ocean alkalinity enhancement does wind up scaling up. We’re in conversation with a number of the marine CDR actors, and we’re definitely going to be talking to them moving forward about what we did, what we saw, and what we think it means for a safe deployment of these approaches. This experiment was permitted for the first time under U.S. federal regulations, so seeing this through, seeing our reports to the EPA through, and having that inform what future permits might look like for these activities, and how that’s going to shape regulations and standards and guardrails and safety measures for environmental monitoring and safety for these approaches – I think there’s a clear pathway for that, and I really hope that it does end up making a difference for how this whole field moves forward.
Jennie: We’re really committed to data availability and transparency. One of our key goals with this project is to generate these data and then share them so that others can use them to make their own assessments and evaluation of the project and of the results. It will take us some time to work through those data and quality control them and make them reasonable for other people to be able to take a look at, but we intend to make those data freely available to other people. That’s one of the really big goals that we have: to make sure that other people have access to the same information that we do.
And it is modeling a little bit of co-design with the fishing community.
Sarah: You alluded to how much planning went into a one-day dispersal and two weeks of measurement activity. That struck me too, as an observer aboard the Mahoney. I’m curious about how the fishing industry entered into that planning, and how input from the fishing industry ended up shaping the project in specific ways.
Adam: Science is a very long process. This effort was three years in the making to make this field trial happen… When it came to community engagement and fishing engagement, that was a process for us where we did have to question some of our assumptions about what we were looking for in this research, who we were doing this research for, and how it might be the most beneficial to any number of communities who worked and interact with the ocean on a regular basis… That feedback absolutely helped us make this project go as smoothly as it did. I think it all served to make the science that much stronger and more impactful.
Jennie: Based on some of the conversation that we had with the [fishing] industry members, we added new components to the project that we hadn’t originally set out to do. That included laboratory studies: we applied for and were slated to do sodium hydroxide-based alkalinity enhancement studies in the lab on lobster larvae and on sea bass and Atlantic herring, as well as the copepod Calanus finmarchicus, which is a key food web species. We started initially with our own funding to do some of those copepod experiments, because they were easier to get spun up, and to refine our methodology while we were waiting for funding to do the fish and lobster experiments. We had originally not included those components in this project, and we added them as a direct response to industry concerns. Unfortunately, that funding [for the fish and lobster larvae studies] got taken back with the new administration and its changes in priorities.
Sarah: That is unfortunate.
Jennie: The other part, too, was that we added a totally new type of net tow. Those neuston tows, which are really the gold standard for looking for lobster larvae specifically, but also helped us sample that shallow surface layer – that was also added on as a response to community questions and interests, and as a recommendation from the fishing industry. We were really trying to do everything we could to incorporate the industry’s suggestions into the project directly. Again, I think that speaks to the value of listening to people who are out on the water every day, with far more experience and knowledge about what they see and what their concerns might be. We just found that invaluable, and incredibly helpful, and are looking forward to coming back and sharing those results once we have them.
Sarah: I’ve been paying attention to mCDR for about a year, and keep hearing this buzzword “co-design,” referring to mCDR projects that are designed through partnership with fishing communities and local communities. Your project maybe wasn’t co-designed from the start, but as you went along, you figured out how to incorporate some elements of co-design into it. Maybe next time around it will be designed that way from the get-go.
Adam: Yep. We’re all learning here how to work together. Absolutely.
Detailed photo captions and credits (top to bottom, left to right):
Research Specialist Jennie Rheuban and Research Associate Brett Longworth discussing data from the ship’s underway system (PC: Daniel Cojanu, UnderCurrent Productions)
Left to right: Scientist Emeritus and co-chief scientist Daniel McCorkle, Research Associate Brett Longworth, and Chief Scientist Adam Subhas discussing data from the ship’s underway system (PC: Daniel Cojanu, UnderCurrent Productions)
Left to right: Research Associate Kate Morkeski, Research Specialist Jennie Rheuban, and Chief Scientist Adam Subhas collecting samples and data from the CTD rosette after recovery. (PC: Daniel Cojanu, UnderCurrent Productions)
Photo of the MBARI Tethys long range Autonomous Underwater Vehicle surfacing during the dispersal (PC: David Nicholson)
Chief Scientist Adam Subhas and Research Associate Kate Morkeski deploying a Bongo plankton net off the stern of the R/V Connecticut. (PC: Daniel Cojanu, UnderCurrent Productions)
Neuston net deployed off the starboard side of the R/V Connecticut. (PC: Daniel Cojanu, UnderCurrent Productions)
Ship underway system plumbed with instruments (left to right): partial pressure of CO2, phytoplankton health (Fv/Fm), pH, oxygen, and rhodamine fluorescence. (PC: Daniel Cojanu, UnderCurrent Productions)
Spray2 glider after deployment (PC: Patrick Deane)


